Randomization and Trial Supply Technology for Real-World Trial Execution
One Connected System for Study Execution
4G Clinical supports randomization, trial supply management, forecasting, reporting, and integrations within a single product framework.
This approach supports complexity, visibility, and change without causing study disruption or compromising data integrity.
Prancer RTSM®
Prancer RTSM® is 4G Clinical’s Randomization and Trial Supply Management platform.
Designed for global deployment, Prancer RTSM® supports studies from early phase through large, multi-country programs, with configuration flexibility aligned to protocol complexity and evolving trial demands.
Functionality That Supports Operational Control
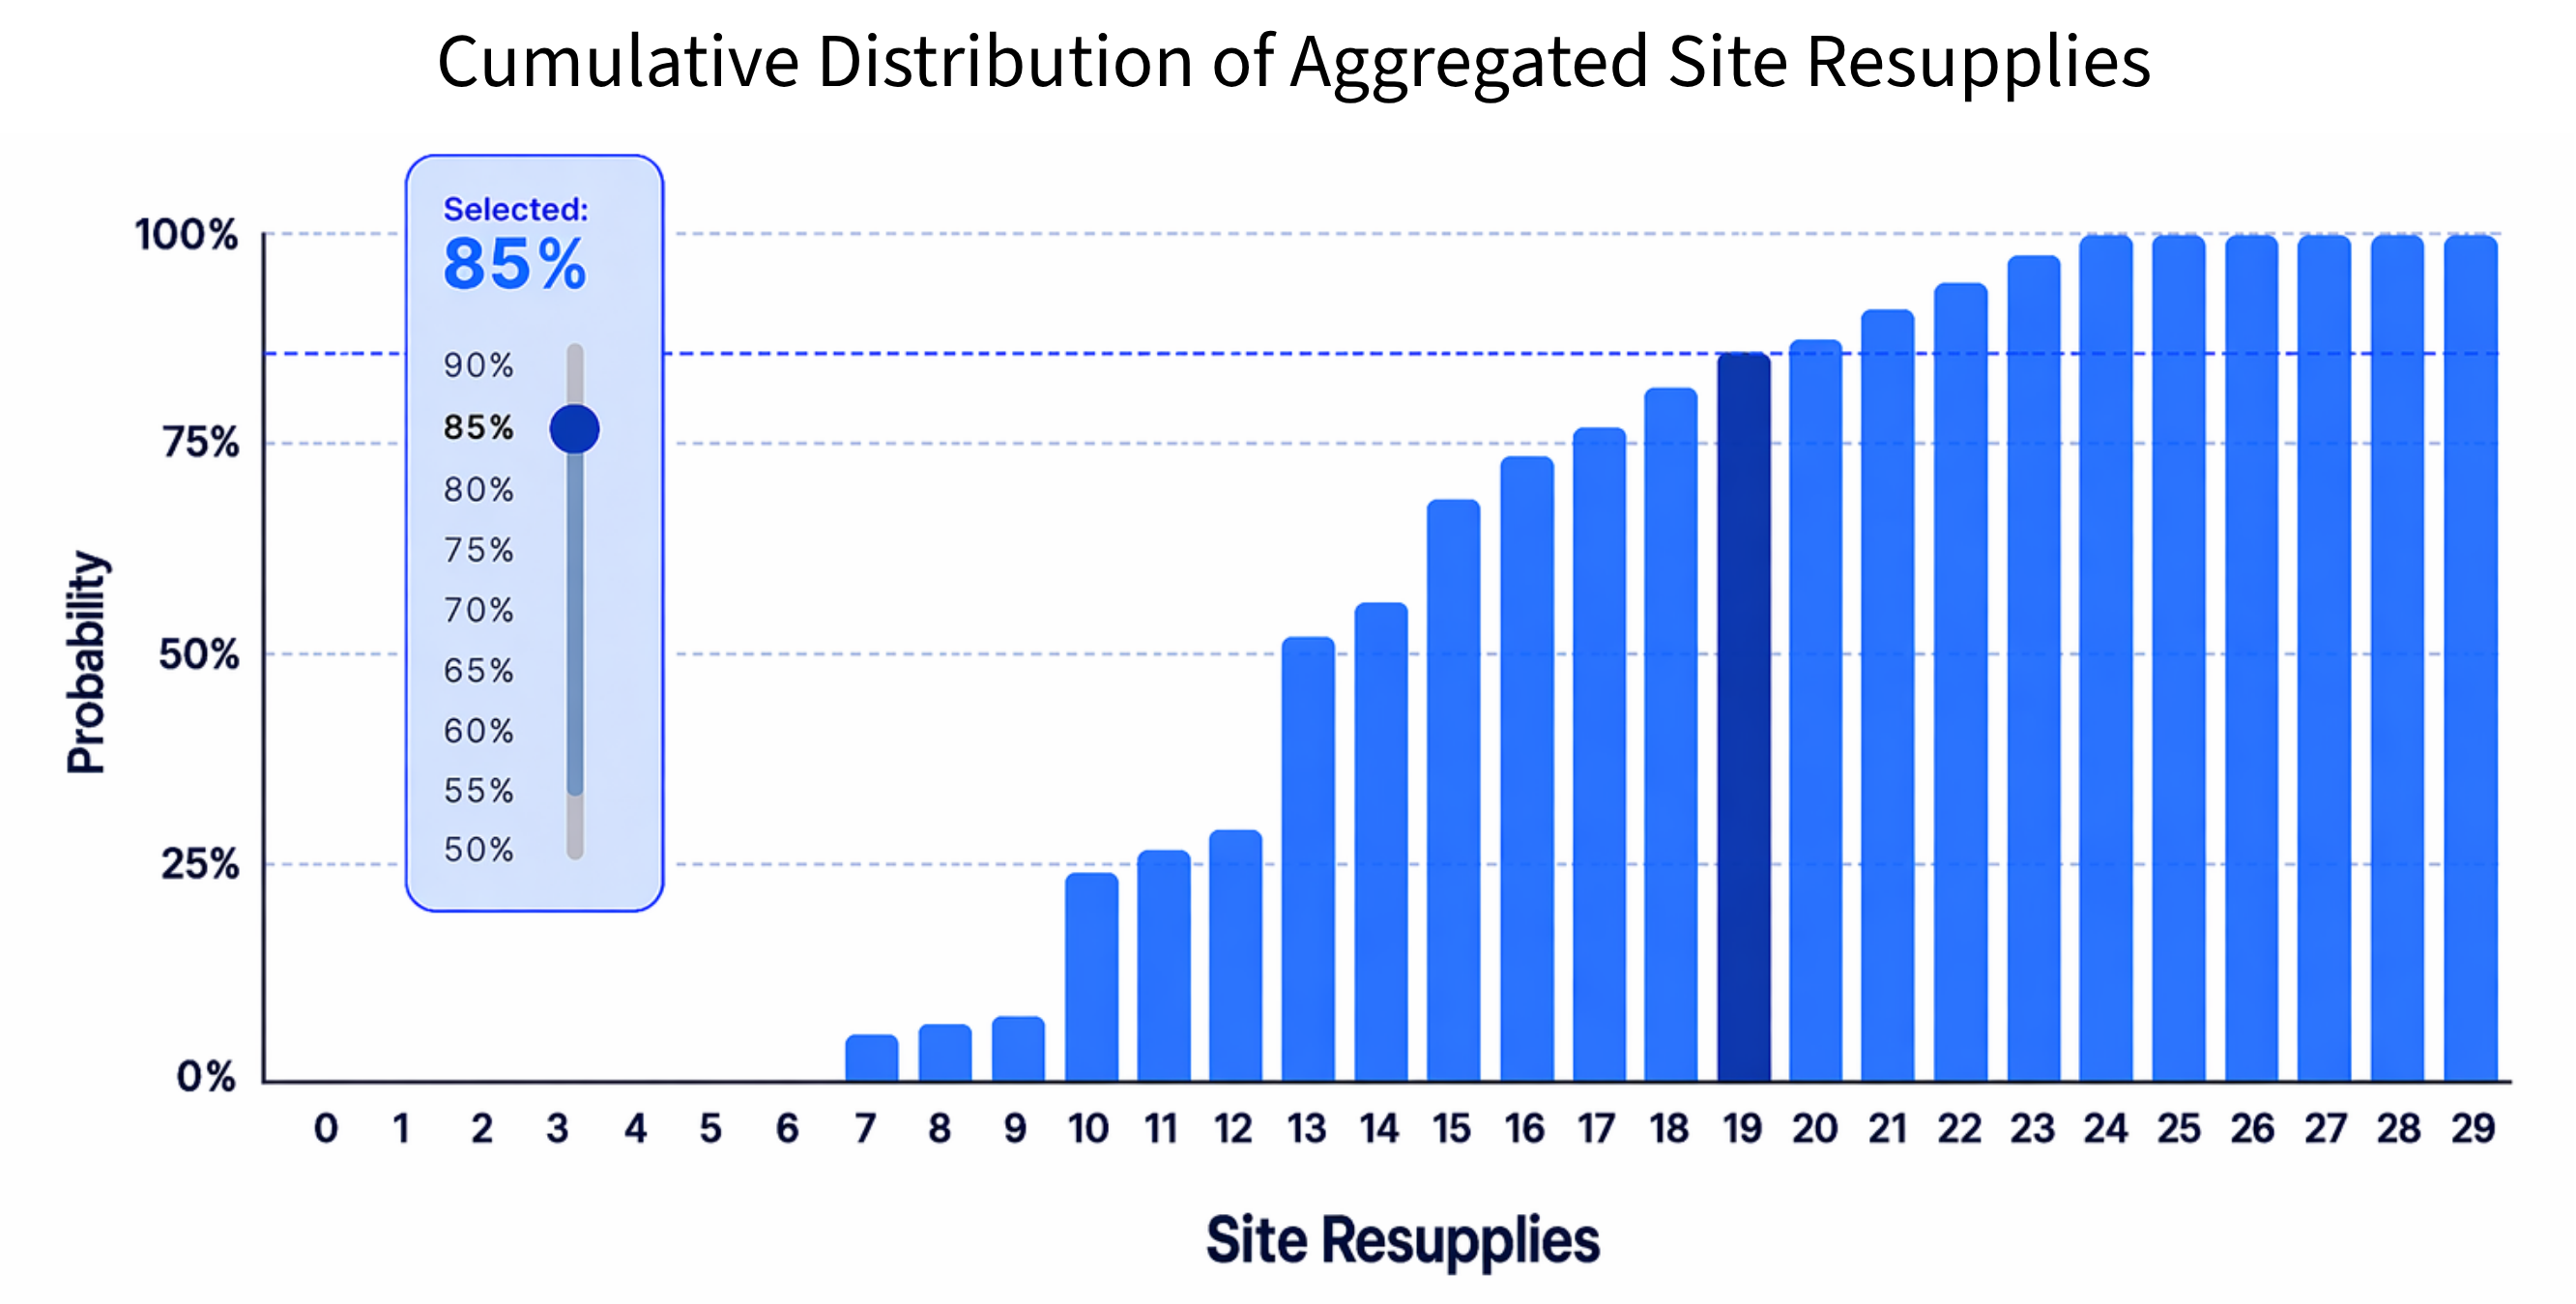
Forecasting & Supply Logic
Prancer RTSM® supports clinical supply decisions with forecasting logic designed to balance safety, cost, and manufacturing.
Its algorithms help predict trial demand more accurately and support a more adaptive supply strategy.
.png?width=2000&name=Cumulative%20Distribution%20of%20Aggregated%20Site%20Resupplies(8).png)
Patient Forecasting Tree
Prancer RTSM® supports greater visibility and control across study execution.
The Patient Forecasting Tree shows each patient’s current position and projects future progression to calculate expected demand.
.png?width=1360&height=504&name=image%20(31).png)
Agile Management for Early Phase Designs
Efficiently manage sites, doses, strata caps, and cohorts through a single, intuitive interface.
Prancer RTSM® is built to be as adaptable as your study requires and allows users to make study design changes over time in a controlled way.

Patient Demand
Calculate. Validate. Deploy. Automatically align patient needs with depot stock through data-driven recommendations.
Generate precise depot requirements using system-led recommendations tailored to your unique presets.

Prancer RTSM Product Family
Clinical trials vary in scope, geography, and complexity. 4G Clinical provides right-sized solutions aligned to those differences.
Prancer RTSM®
Designed for:
Prancer RTSM® is designed for highly complex, global trials where patient allocation, supply behavior, and study oversight need to remain aligned across changing protocol demands, supply strategies, and operational requirements. It is built to help teams absorb complexity without destabilizing execution, while preserving reporting visibility, operational oversight, and control.
Prancer Lite®
Designed for:
Prancer Lite® is a streamlined deployment of Prancer RTSM®, designed for studies that need dependable randomization and trial supply control without the demands of a large, highly complex global build. It supports simpler protocol structures and more defined operational scope, while maintaining the same disciplined standards for quality, validation, and governed study change.
Prancer RTSM® Inventory Platform
Designed for:
Prancer Inventory Platform provides dedicated inventory visibility and resupply management within the Prancer product framework, without requiring full randomization deployment. It is designed for studies or programmes centred on drug supply oversight, supporting controlled execution through configurable resupply logic, site and depot visibility, reporting, and forecasting alignment.
Prancer Kei®
Designed for:
Prancer Kei® is designed for the Japanese clinical trial market, reflecting local regulatory expectations, language requirements, and regional operating practices while maintaining the same disciplined standards as the broader Prancer platform. It supports streamlined deployment for Japan-based studies and provides continuity for sponsors that need alignment between regional execution and wider global programs.
Application:
Complex, global trials
Solution Scope:
Designed for complex randomization, adaptive and cohort-based trials, titration strategies, supply oversight, integrated forecasting, and operational reporting
Designed for:
Prancer RTSM® is designed for highly complex, global trials where patient allocation, supply behavior, and study oversight need to remain aligned across changing protocol demands, supply strategies, and operational requirements. It is built to help teams absorb complexity without destabilizing execution, while preserving reporting visibility, operational oversight, and control.
Application:
Studies with streamlined designs
Solution Scope:
Core RTSM functionality with simplified configuration and a focused feature set
Designed for:
Prancer Lite® is a streamlined deployment of Prancer RTSM®, designed for studies that need dependable randomization and trial supply control without the demands of a large, highly complex global build. It supports simpler protocol structures and more defined operational scope, while maintaining the same disciplined standards for quality, validation, and governed study change.
Application:
Supply-focused studies or programs
Solution Scope:
Inventory visibility, resupply management, integrated forecasting, reporting, along with site and depot supply control without full patient randomization
Designed for:
Prancer Inventory Platform provides dedicated inventory visibility and resupply management within the Prancer product framework, without requiring full randomization deployment. It is designed for studies or programmes centred on drug supply oversight, supporting controlled execution through configurable resupply logic, site and depot visibility, reporting, and forecasting alignment.
Application:
Japan-specific studies
Focus:
Regional deployment aligned to Japanese regulatory standards, language requirements, and operational expectations
Designed for:
Prancer Kei® is designed for the Japanese clinical trial market, reflecting local regulatory expectations, language requirements, and regional operating practices while maintaining the same disciplined standards as the broader Prancer platform. It supports streamlined deployment for Japan-based studies and provides continuity for sponsors that need alignment between regional execution and wider global programs.
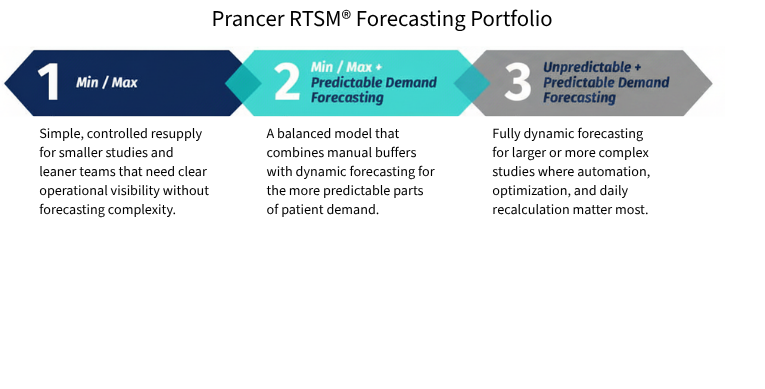
Prancer RTSM® Forecasting Solutions
Forecasting Portfolio
Prancer RTSM® supports a range of forecasting approaches, from buffer-based models to predictive dynamic forecasting. This allows forecasting strategy to match study complexity, supply risk, and operational need.
Depot Demand Forecasting
Prancer RTSM® extends forecasting to the depot level through a unified demand model shared with site resupply. This keeps planning aligned across the supply network and supports more consistent inventory decisions.
4C Supply®
4C Supply® supports portfolio-level clinical supply modelling across manufacturing, distribution, and long-range planning, while Prancer RTSM® aligns resupply to live study activity.
Sponsors use 4C Supply® to model supply risk, production timing, geographic expansion, and cost exposure across scenarios. It integrates with Prancer RTSM®, third-party IRT systems, and enterprise data environments, supporting connected strategic modelling alongside Prancer or consistent forecasting discipline as a standalone platform.
Scenario Modeling and Strategic Supply Planning
4C Supply® supports multi-scenario modeling across manufacturing, packaging, and distribution pathways.
Long-range demand projections reflect enrollment variability, cohort expansion, and geographic changes. Sensitivity analyses allow sponsors to evaluate how shifts in recruitment patterns, production timing, or depot strategy affect supply continuity and financial exposure.
Strategic decisions are informed through forward-looking modeling rather than retrospective adjustment.
.png?width=1093&height=840&name=image%20(25).png)
Portfolio-Level Visibility
Supply rarely exists within a single study.
4C Supply® consolidates demand across programs, enabling aggregated supply visibility and coordinated manufacturing planning.
Operational forecasting and enterprise manufacturing capacity remain aligned, reducing fragmentation between study execution and portfolio strategy.
-1.png?width=1178&height=818&name=image%20(26)-1.png)
Risk Management Reporting
Clinical supply planning requires balancing supply continuity with cost and inventory risk.
4C Supply® supports expiry risk visibility, waste reduction modeling, buffer strategy evaluation, and cost exposure analysis under enrollment variability.
Sponsors can maintain supply continuity while improving inventory efficiency and controlling cost exposure.
-1.png?width=1183&height=848&name=image%20(27)-1.png)
Together, Prancer RTSM® and 4C Supply® support end-to-end IMP management from pre-study planning through live study execution
Prancer RTSM® manages randomization, dispensing, and resupply during study conduct, while 4C Supply® adds long-term forecasting to support supply planning before first patient in and real-time reforecasting as study conditions change.
Advanced Solutions
Dose Escalation and Expansion Studies
RTSM functionality built for dose escalation and expansion studies, supporting flexible cohorts, dosing complexity, dynamic visits, and controlled adaptation as studies evolve.
Early Phase Oncology
RTSM functionality built to support evolving cohorts, dynamic visits, complex dosing, and governed adaptation in early phase studies with changing protocol and operational demands.
Connected Trial Ecosystem
RTSM functionality built to support evolving cohorts, dynamic visits, complex dosing, and governed adaptation in early phase studies with changing protocol and operational demands.
Innovation Implementation Gap
Examine why practical RTSM capabilities recognized during planning and design can still be scaled back, deferred, or excluded before study launch.
Integrations
Built for real-world clinical and supply ecosystems, where connected systems need to exchange data reliably without loss of traceability.
Connected Ecosystem
Integrations connect 4G Clinical systems to the wider clinical and supply ecosystem, supporting reliable data flow across study operations.
Deployment at Scale
4G Clinical supports study-level and enterprise integrations, including Enterprise Prancer Integrations for repeatable deployment at scale.
Traceability Preserved
The integration approach preserves traceability, reduces manual reconciliation, and supports continuity as studies evolve.
Integrations Live
EDC Integrations live
Live Depot Integrations
# Integrations Per Study
Prancer RTSM® and 4C Supply® operate within connected clinical and enterprise ecosystems, where patient data, supply actuals, shipment status, forecasting outputs, and reporting feeds move across multiple systems. Integrations are implemented as part of the product architecture, with validated, monitored, and governed data flows that stay aligned to live study execution.
-
EDC, CTMS, depot, and logistics connectivity
-
Data warehouse, analytics, and reporting feeds
-
Third-party supply and planning tool integration
-
Traceable, governed data movement
Enterprise Prancer Integrations (EPI) centralizes integration configuration at the sponsor level, allowing the same core integration logic to be deployed consistently across studies. This reduces duplication, supports portfolio governance, and makes change easier to manage over time.
-
Faster onboarding of new studies
-
Consistent deployment across programs
-
Centralized logging and monitoring
-
Study-level parameter control
Enterprise Prancer Integrations (EPI) supports configurable integration logic that can be adapted to sponsor-specific data requirements without product redevelopment. As portfolios expand and requirements change, integrations can scale and evolve while remaining aligned to the broader product release structure.
-
Configurable ETL workflows
-
Sponsor-specific logic without hard coding
-
Auto-upgrade alignment with product releases
-
Scale without introducing study-to-study variation
Reporting and Oversight
Operational oversight depends on real-time visibility into study activity, patient progress, and supply status, supported by reliable and traceable data. Prancer RTSM® reporting is designed for live study execution, giving teams structured access to the reports they need for review, analysis, and action.
-
Standard Reporting
-
When more specific insight is needed, users can create custom reports from defined study data sources and configure views to match different operational roles and review routines.
Reports can be saved for reuse and shared with authorized users where appropriate.
-
Custom Reporting
-
Users can configure report views to match operational roles and review routines.
When additional insight is required, users can create custom ad-hoc reports from defined study data sources, save them for reuse, and share them with other authorized users where appropriate.
-
Reporting Hub
-
Reports are accessed through a central hub with search, clear organization, and direct export.
Frequently used and newly created reports remain easy to find, helping teams spend less time navigating the system and more time acting on what the data shows.
-
Reporting Aligned Early
-
Reporting expectations are addressed during study build so outputs are aligned to operational oversight needs from first use.
As study requirements evolve, reporting can be updated in step without unnecessary delay or rework.
Supporting Technologies
In addition to core execution capabilities, the 4G Clinical platform includes supporting technologies that extend operational oversight, regulatory compliance, and portfolio-level data accessibility.
UltimaRand® supports structured patient randomization and kit list generation for studies that require a focused, auditable randomization capability.
-
Structured list generation and controlled allocation logic
-
Version control to preserve traceability as studies evolve
-
Full audit visibility to support inspection readiness
4G DataHub extends Prancer RTSM® into a portfolio-level data environment, enabling structured delivery of study data into sponsor analytics and reporting systems. It supports broader visibility across studies while maintaining alignment with live operational data.
-
Structured delivery of Prancer data for enterprise analytics
-
API-enabled access for sponsor systems, dashboards, and reporting environments
-
Cross-study visibility into enrollment, supply activity, and execution patterns
-
Foundation for future portfolio dashboards and expanded 4C Supply® alignment
The Study Archival Tool supports structured study closeout by enabling compliant site decommissioning within Prancer RTSM®. It provides a controlled process for site data retrieval, while preserving sponsor visibility, auditability, and alignment with required archival expectations.
-
Controlled site download of complete study data packages
-
Real-time visibility into download status and outstanding archival activity
-
Automated prompts and notifications for incomplete retrieval
-
Support for documentation integrity, data retention, and compliant study closure
Request a Demo
Our software and service demos are tailored to your specific needs. Take a thorough tour of our industry-leading solutions.
Form
Demos Can Cover
Focus on a specific functionality. Get to know the people behind our powerful software. Regardless of the demo, our goal is to make the most of your time with 4G Clinical.
- Prancer RTSM® and all configurations
- 4C Supply®
- Site and depot forecasting
- 4G Clinical's approach to partnership
- Our services and support for customer excellence